
Reports & Dashboards
Applies To: Essentials ✅ | Growth ✅ | Pro ✅
Overview
The Sales Hub Accelerator includes a comprehensive suite of over 50+ prebuilt reports and 4 strategic dashboards, designed to deliver immediate visibility into CRM usage, data quality, pipeline performance, and team productivity. These analytics tools support individual reps, managers, and administrators in driving data-backed decisions and identifying high-impact areas for coaching, optimisation, and growth.
Report Folders & Organisation
All reports and dashboards are grouped into dedicated Lightning folders for ease of access, sharing control, and logical separation by theme. Each dashboard has an associated report folder containing all source charts and data visualisations.
Folder Name | Type | Description |
|---|---|---|
Accelify – Data Completeness Dashboard | Lightning Dashboard Folder | Visualises completeness of Leads, Accounts, and Opportunities |
Accelify – Data Completeness Reports | Lightning Report Folder | Source reports driving field completeness metrics |
Accelify – Adoption Dashboard | Lightning Dashboard Folder | Tracks CRM logins, usage, and record creation patterns |
Accelify – Adoption Reports | Lightning Report Folder | Reports supporting CRM adoption and engagement tracking |
Accelify – Sales Reps Dashboard | Lightning Dashboard Folder | Displays rep-specific pipeline, activity, and lead performance |
Accelify – Sales Reps Reports | Lightning Report Folder | Individual-level reports for sales rep performance and action |
Accelify – Sales Manager Dashboard | Lightning Dashboard Folder | Shows team-level metrics across activities, deals, and health |
Accelify – Sales Managers Reports | Lightning Report Folder | Reports supporting manager reviews and performance oversight |
Accelify – Embedded Record Reports | Lightning Report Folder | Utility reports used in record pages, flows, or components |
Dashboards
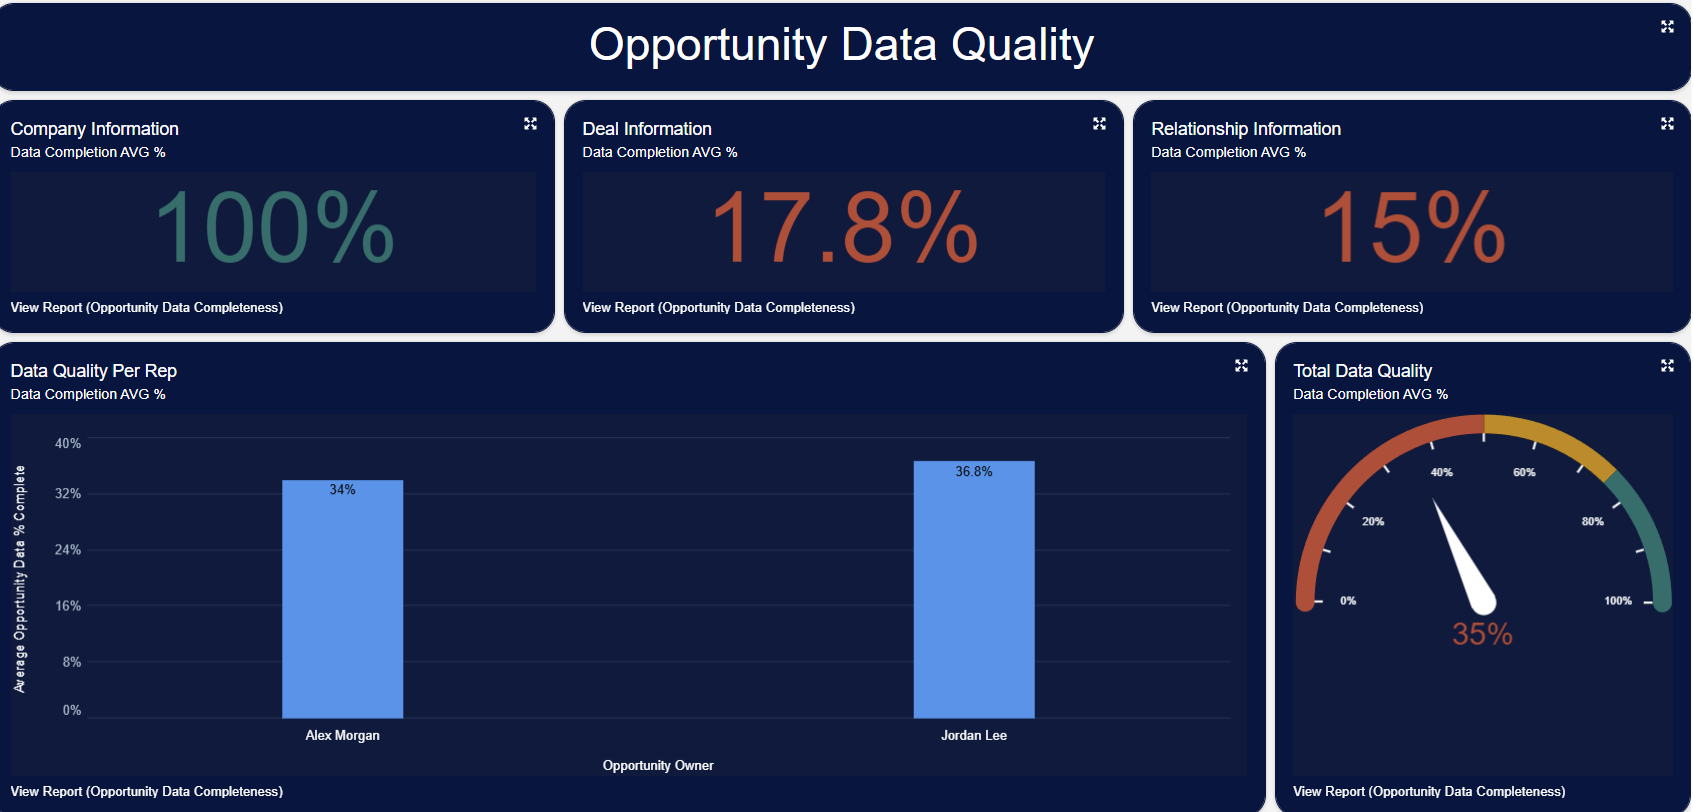
1. Data Completeness Dashboard
Purpose:
Monitors the completeness of CRM records such as Leads, Accounts, and Opportunities. Ensures critical fields are consistently populated for reporting, automation, and forecasting readiness.
Common Metrics:
Lead Data Completeness (%)
Opportunity Data Completeness (%)
Account Data Completeness (%)
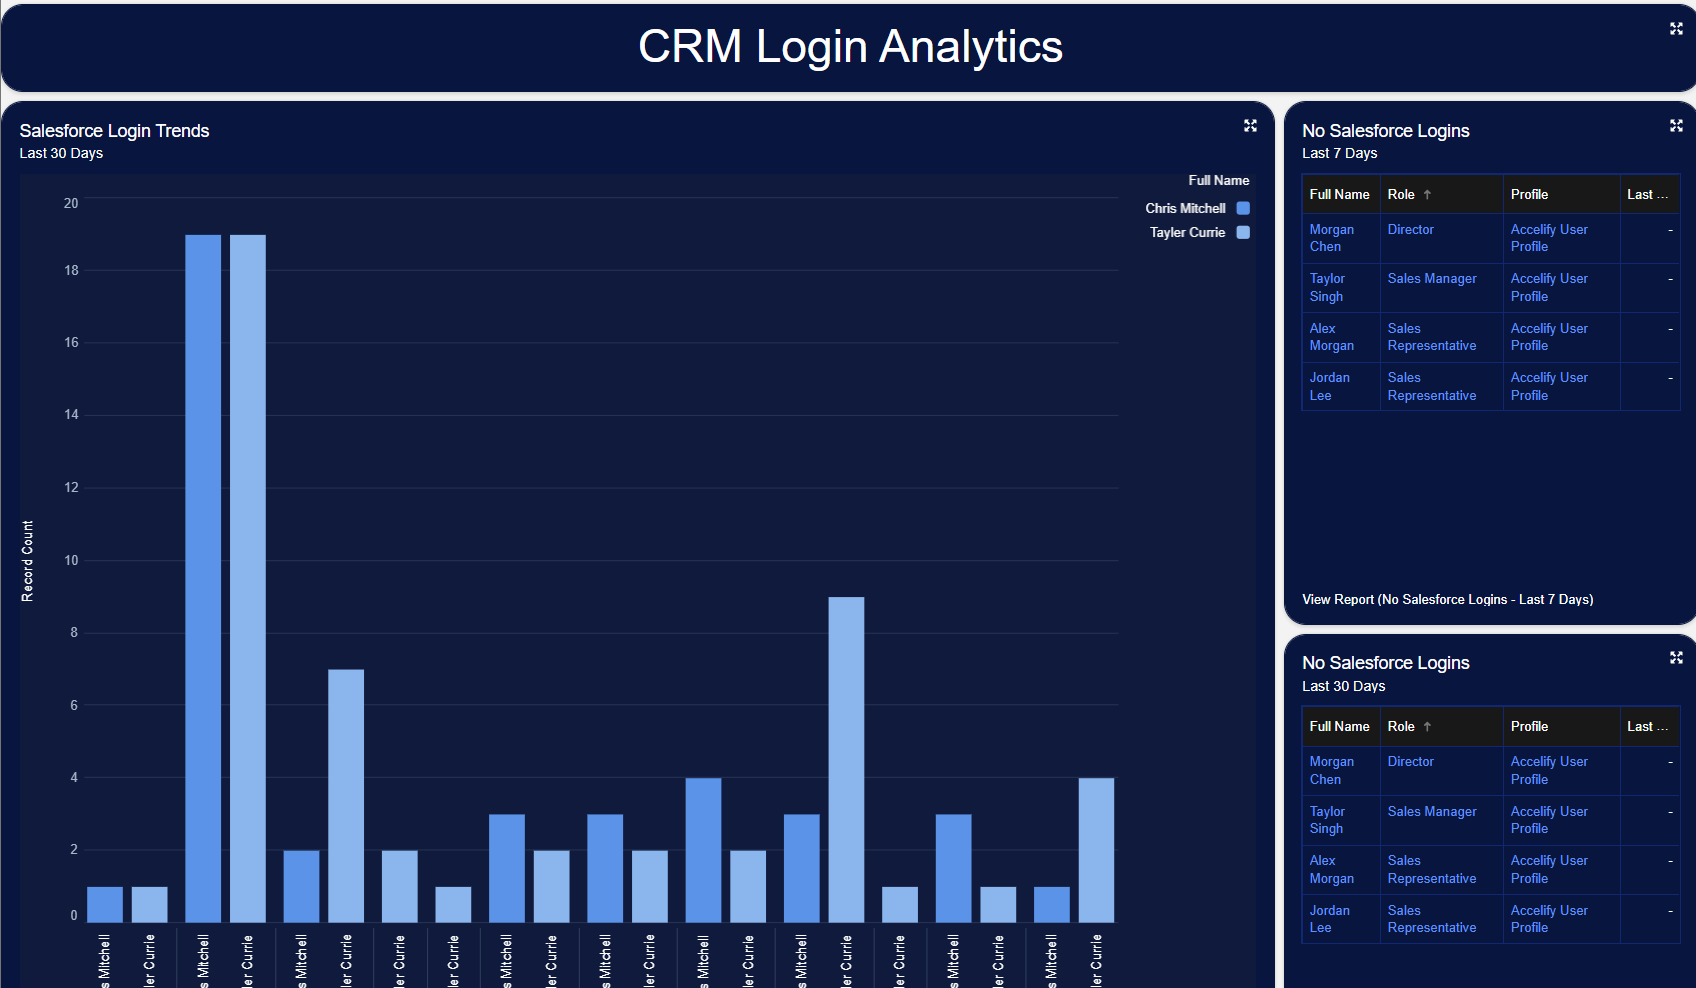
2. Adoption Dashboard
Purpose:
Tracks user engagement across logins, record creation, and activity logging to surface CRM adoption patterns.
Common Metrics:
CRM Login Trends by Role
Records Created Per User
Activities Logged Per Day
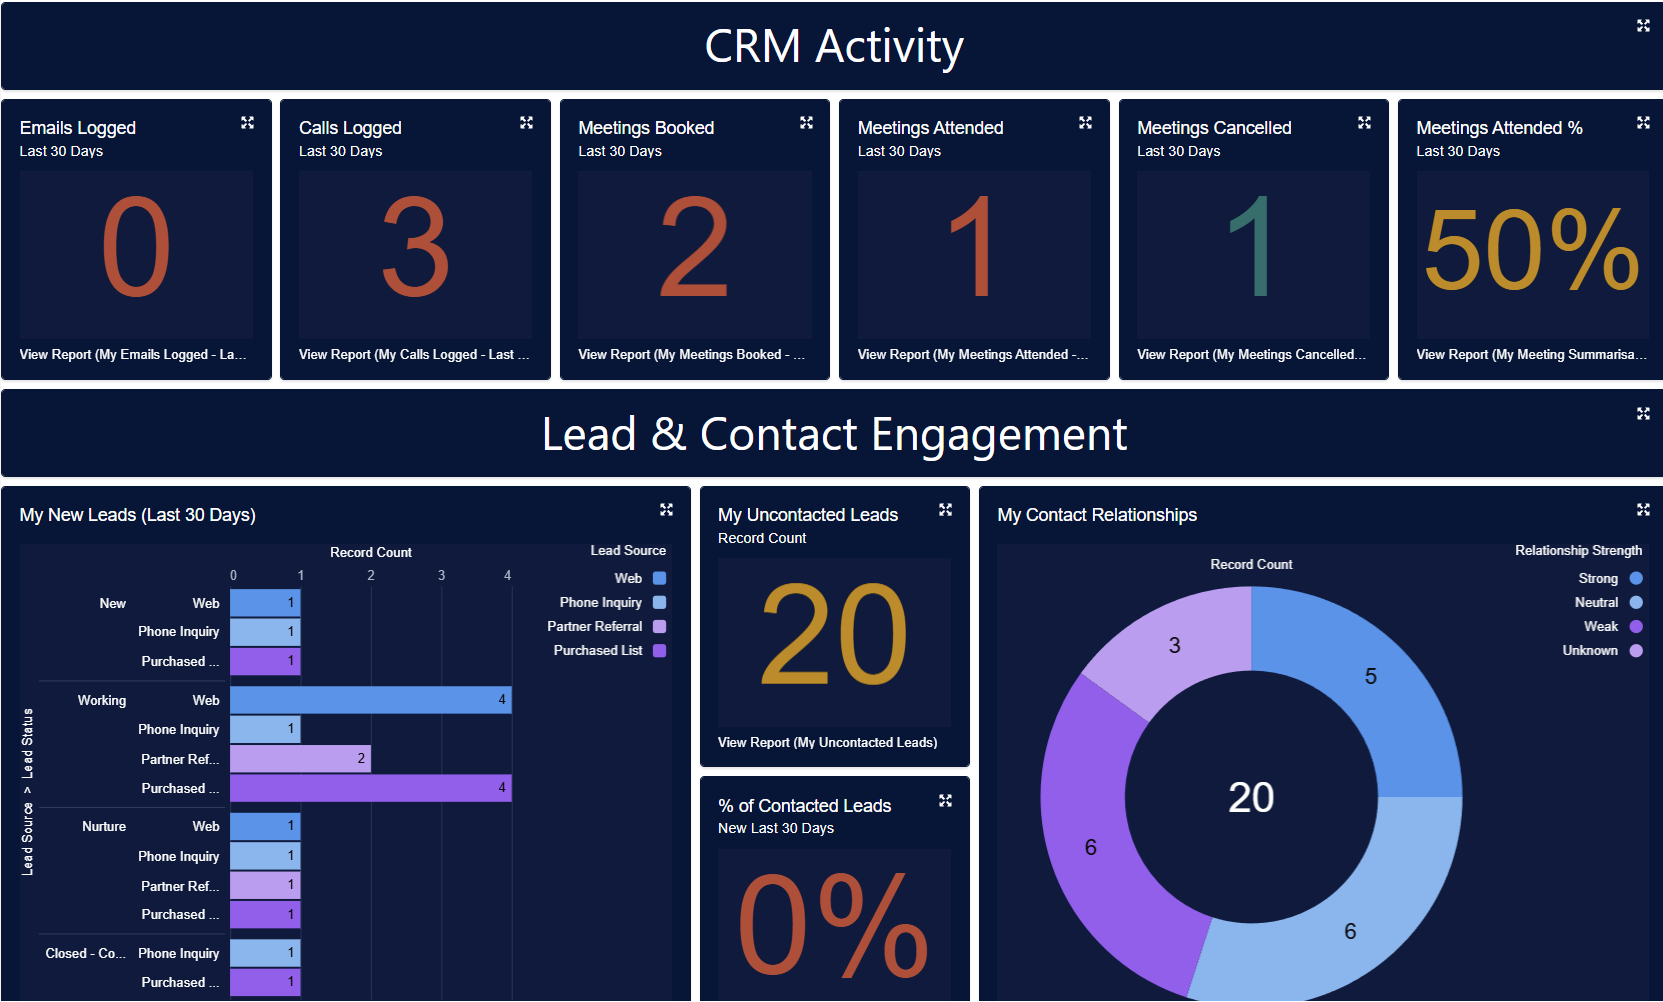
3. Sales Rep Dashboard
Purpose:
Provides individual reps with performance visibility, including pipeline progress, lead engagement, meeting activity, and target alignment.
Common Metrics:
Activities by Type (Calls, Emails, Meetings)
My Open Pipeline (by Stage)
Conversion Rate
Lead Follow-up Completion
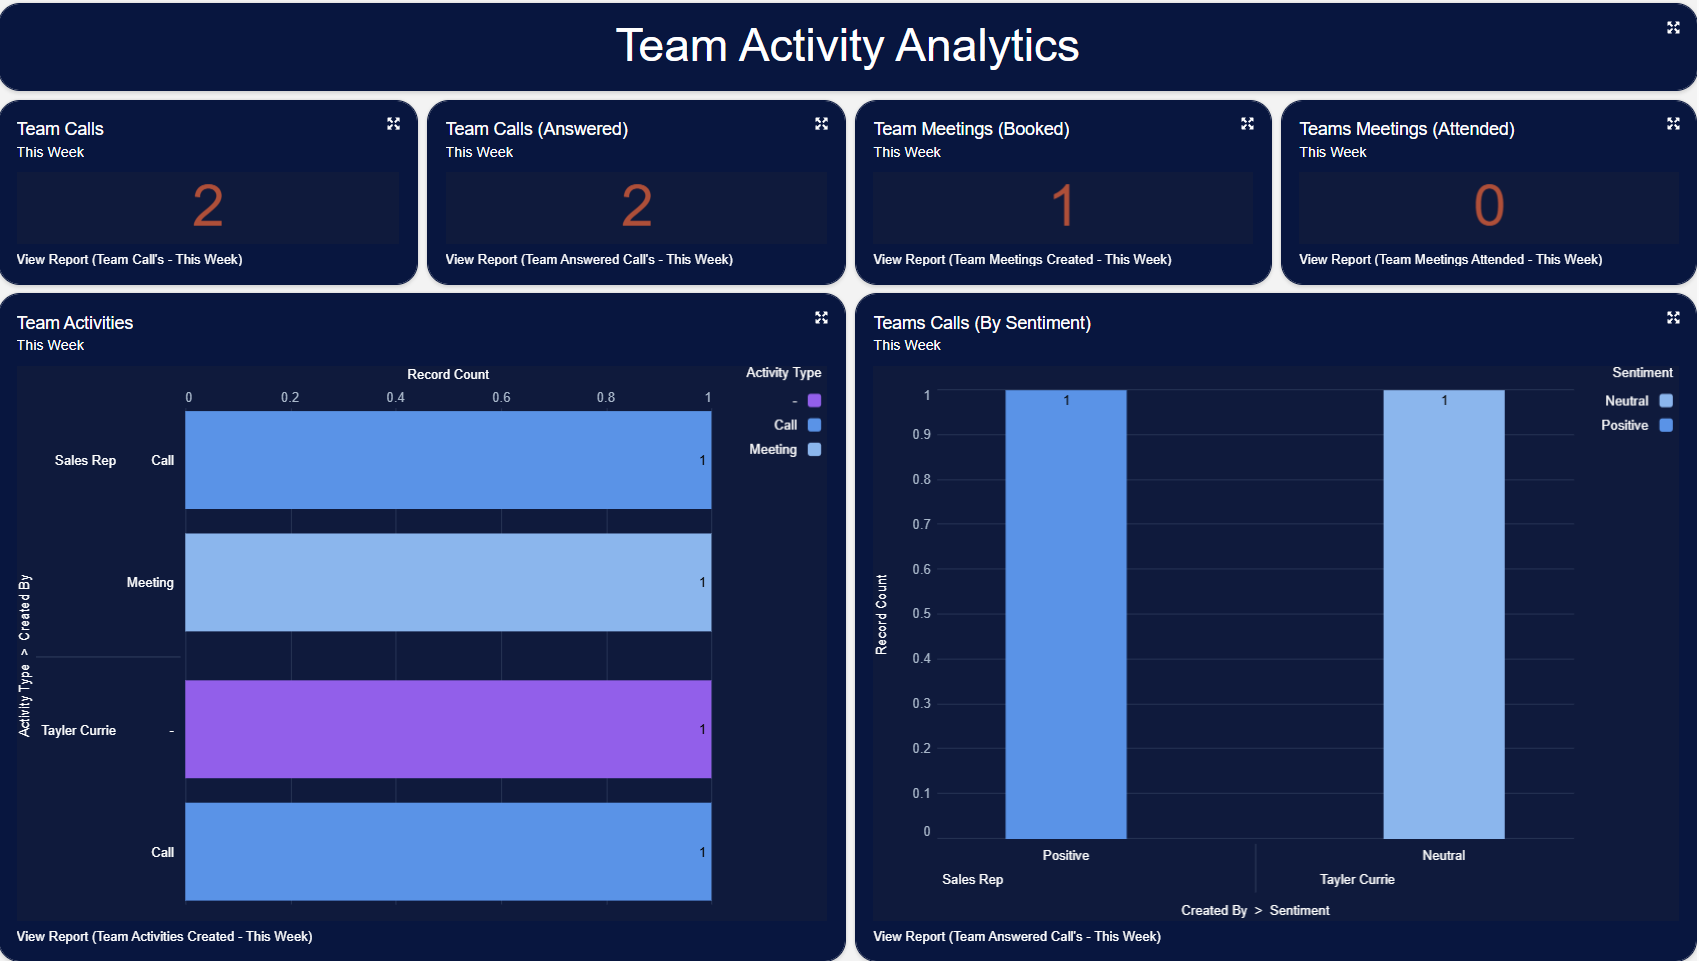
4. Sales Manager Dashboard
Purpose:
Gives sales leaders a high-level view of team health and performance, helping managers track activity, detect at-risk deals, and coach more effectively.
Common Metrics:
Team Activities Logged
Win/Loss by Rep
Team Pipeline Value
Leads Assigned vs Converted
Report Highlights
Your Sales Hub package includes over 50 curated reports spanning:
Pipeline & Forecasting
Lead & Opportunity Conversion
Activity Tracking (Calls, Emails, Meetings, LinkedIn)
Data Quality (Completeness, Hygiene, Audit)
User Adoption & Login Analytics
Performance by Rep, Team, Role, Industry, Source
Summary
Sales Hub’s reporting layer turns your CRM into a live performance engine. With out-of-the-box dashboards for reps, managers, and admins, and a suite of best-practice reports for adoption, quality, and forecasting, your team gains visibility that drives action. No manual builds. No guesswork. Just clear, guided insight.
Version: 1.0.0
Updated: 16 May 2025